Energy Institute Blog
Research that Informs Business and Public Policy
New research examines the role of individuals versus places in determining household carbon emissions. Source: Smiley N. Pool / Houston Chronicle, Shutterstock
The average household in San Francisco emits 36 percent less CO2 from residential and transportation energy use than the average household in Houston. Within the San Francisco Bay Area, the top 10 Census tracts with the highest household carbon emissions emit, on average, 5.6 times more per capita than the 10 lowest emissions Census tracts. Researchers and policy makers have recently highlighted the tremendous spatial variation in household carbon emissions, both within and across cities. See e.g. here and here.
Some of these differences can be explained by household characteristics, such as household size and income; some can be explained by gas versus electric heating or type of automobile. The remaining variation has historically been attributed to characteristics of the places themselves and how various amenities (e.g., climate, density, public transit, walkability) correlate with average carbon footprints.
Average Household Carbon Emissions in San Francisco Bay Area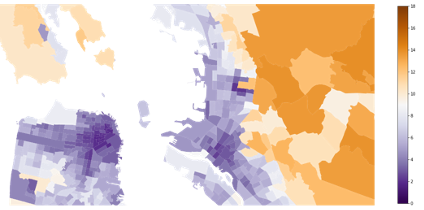
Figure shows average household carbon emissions from residential and transportation energy by Census Tract in the San Francisco Bay Area. Units are annual tons CO2 per household. Data source Green and Knittel, 2020.
This spatial variability could present an opportunity – perhaps we can learn from these places with low carbon footprints to better design and implement similar policies and practices nationwide in a quest to decarbonize the US economy.
A new paper by the Energy Institute’s own Eva Lyubich, available here as a new Energy Institute working paper, explores these issues in detail. The starting point of her paper is to recognize that people make choices about where they live, so different types of people live in different types of cities. Some people want to live in cities where they can drive to work, others prefer to commute via public transit or bike or walking. Some people want to live in a 3-bedroom house with a yard and others prefer an apartment building near lots of other people and restaurants. Through this lens, one quickly starts to realize that a lot of the differences we see in household carbon emissions across the US come from a mix of the characteristics of a particular place and the characteristics and preferences of people who choose to live there.
This distinction between people and places is fundamental, because if policymakers were to adopt some of the low carbon “best practices” from green cities and apply them elsewhere, we may receive much lower carbon benefits than observational differences may suggest. Said differently, someone from Houston, TX who loves to drive their SUV may not be as inclined to ride a new expansion in public transit as someone from New York City.
Eva explores these questions by using restricted-access data from the US Census. With this data, Eva can track millions of (anonymized) people who moved between 2000 and 2019. She can also see how much households reported spending on residential energy last year, how long each individual’s typical commute was, and whether they commuted by car, public transportation, walking or biking. She combines this with information on energy prices and carbon intensity by location, which allows her to quantify individual and household carbon emissions for each respondent.
Eva can then ask, “By how much do household carbon emissions change for someone moving from Houston to San Francisco?” and “How does this change compare to the average differences between these cities?” Repeating this exercise millions of times, she can start to separate out the role of people versus places in contributing to the overall variation in household carbon emissions.
Learning from Movers
Another way of framing the same question is to ask how much a person’s location determines his or her GHG emissions. If I move from San Francisco to Houston, would my carbon emissions increase?
The figure below, taken from Eva’s paper, presents the result. The figure shows that when someone moves to a higher emissions metropolitan area their own emissions increase by almost the entire gap between their origin and destination city. This change in household emissions isn’t entirely surprising given what we know about differences in climate and electricity sources between cities, but the size of the effect is surprising for two reasons: (1) differences in household characteristics like income and household size explain a lot of the variation in CO2 footprints, and it could have been the case that these characteristics were more important than the places themselves, and (2) there is a lot of neighborhood variation within a metro area, and mobile households could selectively sort to the neighborhoods in their new city that are most similar to the places they came from.
Moves Across Cities
Figure shows average changes in household carbon emissions for movers by differences in origin-destination mean emissions for cities (CBSAs).
So to dig into this further, Eva takes advantage of the detailed geographic information in her survey data and redoes this exercise with people who move across neighborhoods. This result is shown on a similar figure below. She finds that when households move across neighborhoods, their emissions change by roughly 60% of origin-destination mean differences. In other words, more than half of the differences between neighborhoods can be explained by the place itself. The remaining share is driven by people with different preferences living in different neighborhoods, and if you simply compared the average differences in household carbon emissions between places you’d overstate the potential carbon reductions.
Moves Across Neighborhoods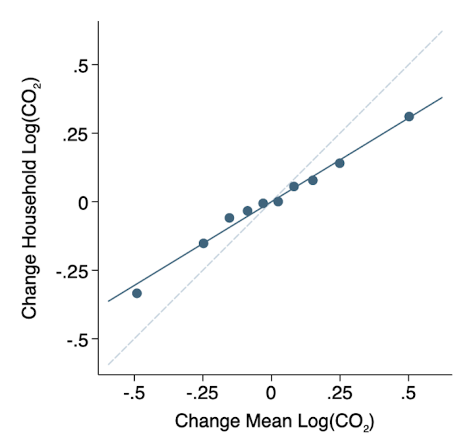
Figure shows average changes in household carbon emissions for movers by differences in origin-destination mean emissions for neighborhoods (Census Tracts).
So what? How important are places in determining carbon emissions relative to other household factors, such as income? Eva finds that places explain 25% of overall variation in carbon emissions across households. About 10 percentage points of this effect comes from differences across places in climate, the carbon intensity of the grid, and local energy prices; the remaining 15 percentage points stem from other characteristics of places (e.g. walkability, transit, density).
Policy Implications
Eva uses her estimates to better understand the potential carbon reductions from placed-based investments or regulatory changes. For example, how much would Bay Area household carbon emissions fall if Oakland, Hayward and other parts of the East Bay looked more like San Francisco? She does this thought exercise for close to 1000 cities in the United States. On average, she finds that household carbon emissions would fall by 15 percent (even though, on average, central cities are about 27% lower emissions than their surrounding suburbs).
Taken together, Eva’s results provide new evidence on how important cities and neighborhoods are in driving household carbon emissions. The answer is nuanced. The characteristics of cities and neighborhoods play a key role in a household’s carbon footprint, though their importance will be overstated if one just compares differences in carbon emissions across places. Placed-based investments in public goods that reduce carbon emissions, like transit, could still lead to carbon footprint reductions for many households at once. Work like Eva’s is critical to identifying public investments that can decrease emissions at the lowest cost.
Keep up with Energy Institute blogs, research, and events on Twitter @energyathaas.
For details see Eva Lyubich, “The Role of People vs. Places in Individual Carbon Emissions” Energy Institute Working Paper, UC Berkeley, December 2021.
Suggested citation: Walker, Reed. “Are Your Greenhouse Gas Emissions All About Location, Location, Location?, UC Berkeley, December 6, 2021, https://energyathaas.wordpress.com/2021/12/06/are-your-greenhouse-gas-emissions-all-about-location-location-location/
Categories
Uncategorized
Tags
climate change, energy efficiency, greenhouse gas, transportation
This is good stuff, thanks.
The introduction of the paper discussed in the blog post raises a relevant question:
“If places with large single-family homes and car-oriented transportation infrastructure are high emissions because the people who live there dislike multi-family homes and public transit, then deregulating zoning or building new subway lines would have little impact on household emissions and could end up being an expensive decarbonization strategy.”
The blog post itself states that “places explain 25% of overall variation in carbon emissions across households. About 10 percentage points of this effect comes from differences across places in climate, the carbon intensity of the grid, and local energy prices; the remaining 15 percentage points stem from other characteristics of places (e.g. walkability, transit, density).”
The naïve urbanist viewpoint has been that high-density urban living is good for the environment. The paper and blog post suggest this may be an overstatement. These issues are important because with Covid and the aging of the millennial cohort, the demand for detached (single-family) homes has risen. Freddie Mac pointed out the starter houses are in short supply. Given all this, perhaps the policy goal should be to focus on increasing the energy-efficient of starter homes and associated transportation energy expenditures.
Three other points:
1) The study is restricted to household and transportation energy use and does not include energy expenditures embodied in household consumption of other goods and services. However, the Kammen paper linked in the blog post does include these energy expenditures.
2) Another neglected source of energy use is urban non-household energy expenditures from sources like lobby lighting, HVAC systems and the energy bodied in steel and concrete construction techniques, including excavation. See the New Geography blog on high density and sustainability.
3) Carbon taxes could go a long way towards addressing some of these issues. I personally don’t care if someone wants to live in a big country house and drive a pickup truck—just as long as they pay the fully loaded social costs of their lifestyle choices. As the neoclassical economist in me says, “don’t moralize, just get the prices right.”
This may be an interesting starting point for determining the best way of cutting carbon emissions, but requires a cost per tonne of carbon to drive policy. For example, new rail transit systems require a huge subsidy far in excess of what any user will pay. Therefore car drivers or those using other forms of transport must be subsidizing the new rail system. Therefore the cost per tonne of carbon reduction may be very high, if not negative compared to electric cars running on renewable energy.
Any reports on carbon footprint should discuss the cost of carbon reduction per tonne in order to promote sensible policy.
This is quite an interesting paper. I’m on a local commission trying to put together an updated climate action and adaptation plan (CAAP) and knowing what lessons might be applicable to our setting is important. For example, I looked at the difference in density between Oakland (net of the Regional Parks) and San Jose and it looks like transit becomes an attractive alternative once density approaches 9,000 per square mile. So adding transit service may not be effective in the smaller cities on the periphery of the Bay Area.
I’m having a problem putting together two of the quantitative findings (and admittedly I haven’t read the paper to sort this out). The first is that moving between cities explains nearly 100% of the difference in emissions, presumably matched by household characteristics such as income, size and ethnicity. (Are there non-household characteristics in this list as well?) And on a related basis that moving between neighborhoods explains 60% of the difference. The second is that these place differences then explain only 25% of the differences in emissions, with 10% explained by climate and electricity sources. Is this paper saying that 75% of the differences are explained by household characteristics?
If I’ve discerned the implied result, then that has two important policy implications. The first derives from the direct finding in the paper–that the main way to reduce emissions in those locations will be either increasing density in suburban and rural areas (not politically popular) or to rapidly electrify transportation modes. (That’s for a separate discussion.) The second falls out of the indirect finding–the main way to reduce the lion’s share of emissions is to focus on wealthier households to reduce their fossil fuel consumption. We should put aside emission reduction policies focused on low income communities because we don’t derive much benefit (because they already are low emitters) and instead focus on adaptation for them since they don’t have the same level of resources to be resilient to climate change consequences. This may look like yet more give aways to the wealthy, but we don’t have much time to transform our energy systems so we need to move post haste down the most productive path. Even so, we need to make sure that we ameliorate the economic consequences, dislocations and inequities.
> …the top 10 Census tracts with the highest household carbon emissions emit, on average, 5.6 times more per capita than the 10 lowest emissions Census tracts…
This figure seems quite low. Are you excluding air travel perhaps?
Visit Our Website
Join Our Email List
Donate Today
Unauthorized use and/or duplication of this material without express and written permission from this site’s author and/or owner is strictly prohibited. Excerpts and links may be used, provided that full and clear credit is given to the author and the Energy Institute with appropriate and specific direction to the original content.