Htop is a process manager that allows us to see the processes in execution and the usage of system resources using the Linux terminal. With its text-based interface that supports the mouse, we can easily operate it and perform various functions such as it is very easy to kill any process on htop. In short, it has all functions we required to monitor and manage system processes using the command terminal. Further, easy to understand due to the simple fields of CPU, Mem, PID, and Command when opening htop.
At the top of htop, the usage rate of each CPU will be listed. It is worth noting that the number of logical cores of the CPU is displayed there. However, htop is no the only way on Linux to monitor process and hardware resources there are other good options as well. Thus, that’s why we decided to come with some good htop alternative tools in this list.
Contents
As compared to htop, Glances as an alternative offers two ways to access the system monitoring data. One is using the web interface and the other is the local terminal. Just like htop this one is also an interactive text-based performance monitoring tool. It has been written in Python, thus, supports any major platform having python installed such as Windows, macOS, Linux, FreeBSD, and Android.
One can use its client-server model to monitor remote systems either using SSH, web interface, or API (XML-RPC and RESTful). Stats can also be exported to files or external time/value databases such as InfluxDB, Cassandra, CouchDB.
On Ubuntu, Linux Mint, CentOS, RHEL, and other Linux, the users can install it with just one command, i.e-
However, the uses of htop will not find Glances much colorful which may create confusion to them sometimes, nevertheless, having a network bandwidth monitor gives it one plus point.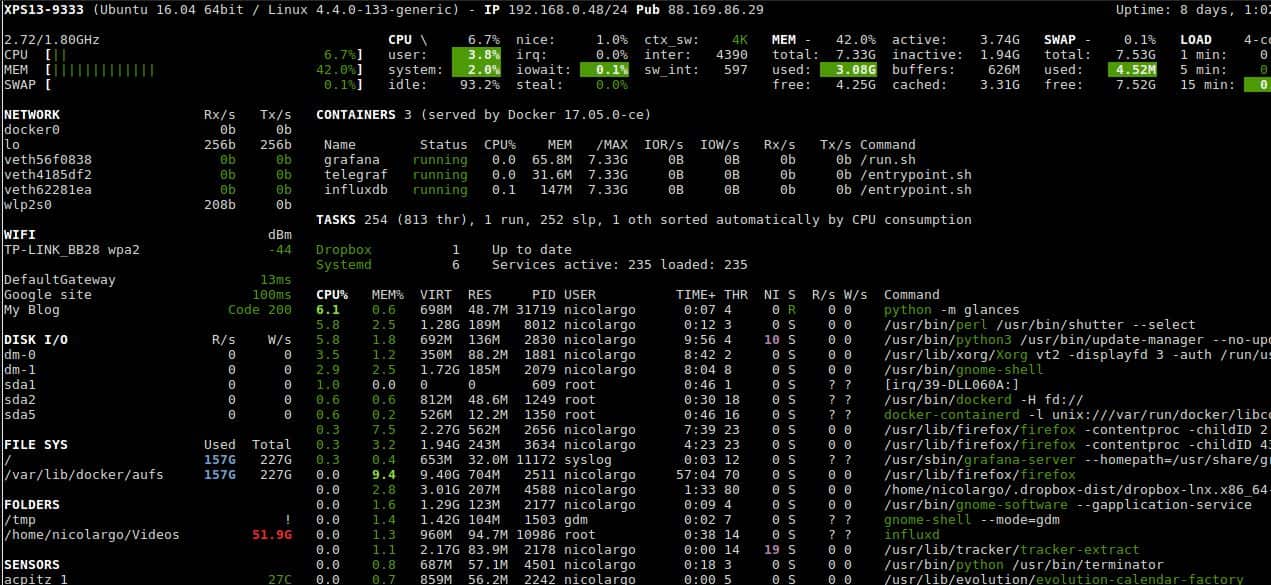
nmon is another htop alternative that stands for “Nigel’s performance Monitor for Linux”. It is a system administrator, tuner, benchmark tool that allows users to get a wide range of data on system performance. We can get the data output using nmon either using command terminal or export it in a common separate file for analysis and longer-term data capture. With the help of nmon Analyser Microsoft Excel spreadsheet, which loads the nmon output file, the user can generate dozens of graphs to analyze the system deeply. Developers of this tool offer a single binary that will work all popular Linux systems such as Red Hat, SUSE, Ubuntu, Fedora, OpenSUSE, etc.
Website link
nmon installation
For Debian/Ubuntu Debian based systems-
On Redhat, CentOS, ALmalinux, Fedora, and other RPM distros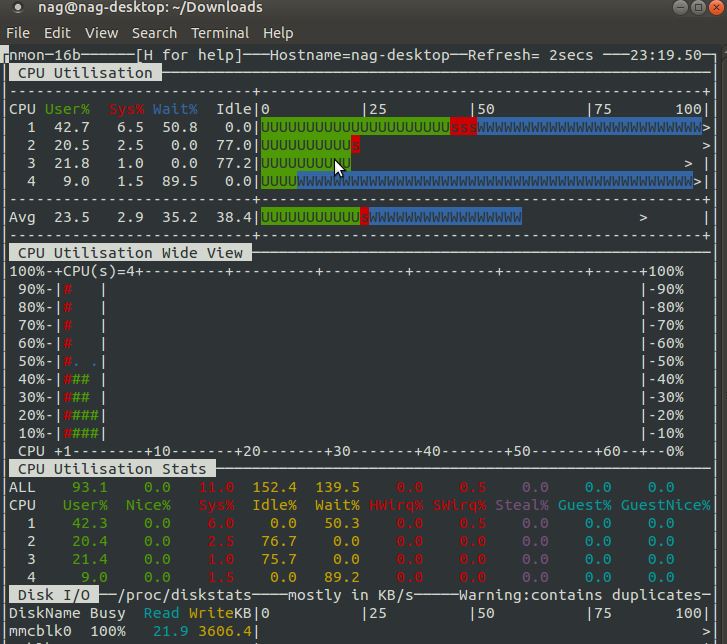
Netdata Monitoring is an ingenious tool to monitor Linux systems in terms of performance data. It is one of the popular tools and can be a great alternative to htop for those who want a web-based monitoring tool. Yes, Netdata provides a dashboard accessible through any browser. It also allows an alarm to be sent to all performance data. Netdata offers a well-organized dashboard in which you can find all the data about the system.
Similar to Grafana, you can set when you want to see the data. Live monitoring included. The whole tool is kept very lean and requires few resources. We can install it on any Linux system or virtually using a Docker container to monitor your entire Docker node including the running Docker container. Whereas, to more streamline big infrastructure, Netdata also offers Netdata Cloud in free and paid plans.
Furthermore, it offers 200+ turnkey integrations to monitor various applications such as Apache, CockroachDB, Containers, Docker, Elasticsearch, IPFS, Kubernetes, MongoDB, MySQL, Network UPS, and more. To give you thousands of real-time, per-second meaningfully metrics visualization.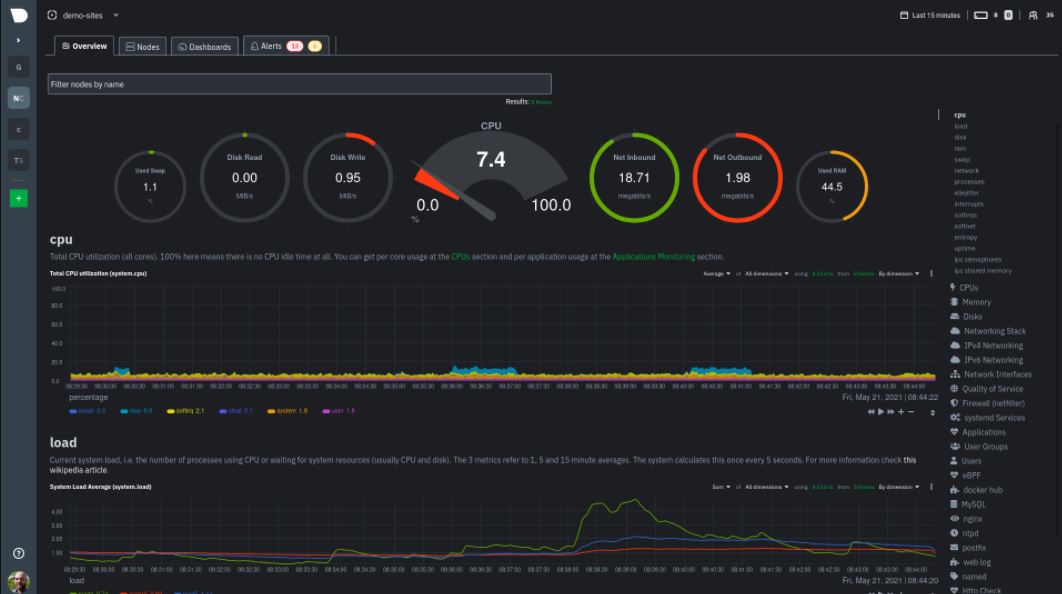
Command to install on Linux
or see: How to install Netdata on Linux such as Ubuntu 20.04
Well, Stacer is a slightly different alternative to Glances and htop because it offers full fledge graphical user interface with options for system optimizing, cleaning & repo management apart from monitoring ones. You can say it is a CCleaner replacement for Linux systems.
Stacer can be used for managing of starting and stopping system services along with process management and sorting of the same by PID, CPU and memory usage, etc. It also provides a resources tab to view CPU, RAM, Disk, CPU Load Average, and network activity usage along with the graph.
Furthermore, the startup management with just one click removes the headache of beginners to mingle with commands to tell the system which application needs to be started automatically on the next machine boot.
Stacer is available for both Debian and RPM-based systems, whereas its AppImage package enables users to install Stacer on any popular Linux distro. Website Link
For Ubuntu-based system, Stacer can be installed using the following commands-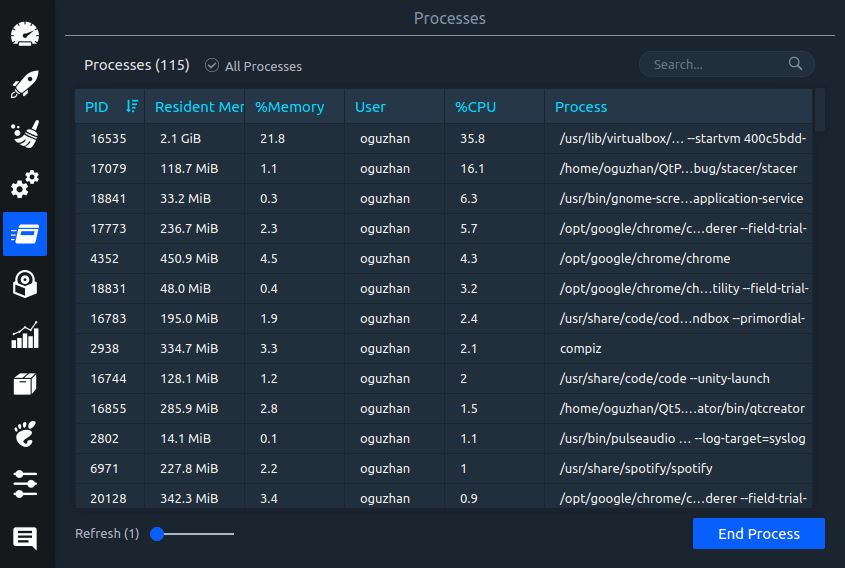
To make “top’ like a command-line tool to monitor CPU and memory along with processes more easily, vTop has been introduced. It is also a free and open-source system resource and process monitoring tool.
This terminal activity monitoring tool is written in Node.js. However, compared to htop, alternative vtop’s functionality is limited. Nevertheless, it lets us monitor CPU usage, processes, and memory usage even the unwanted spikes.
To show charts of CPU and memory usage to understand when you got spikes in their usage, vtop uses Unicode braille character
However, if you have Nodejs installed on your system, then you can use the NPM package manager to easily install and start experiencing vTop.
Install Nodejs & NPM on CentOS 8 or Ubuntu however, if your not a Linux user then see the Nodejs installation on Windows.
Ending thoughts:
Well, there are dozens of paid and free enterprise network and system monitoring tools, however, those who want something easy to install and without unnecessary complications can for any of the htop replacements given in this list. If you are using any tool which is not on the list, then let’s know the specialty of that, the comment section is all yours.
Heyan Maurya Linux
3026 Views
Heyan Maurya Linux
Heyan Maurya Linux
6506 Views
Heyan Maurya Linux
document.getElementById( “ak_js_1” ).setAttribute( “value”, ( new Date() ).getTime() );
This site uses Akismet to reduce spam. Learn how your comment data is processed.
Linux Shout crafted as a part of our main portal H2S Media to publish Linux related tutorials and open source Software.


